Most UA conversations start and end with acquisition. CPI, install volume, ROAS, channel mix. These are the metrics that dominate weekly reviews and quarterly planning.
Retention sits in a different room, usually with the product team, evaluated on a separate dashboard, treated as a product problem rather than a growth problem. The two conversations rarely happen at the same time with the same people.
That separation is costing real money, and the data makes exactly how much very clear.
Average Day-30 retention across all app categories sits somewhere between 4% and 7% in 2026, depending on the source. Whichever benchmark you use, the conclusion is the same: more than 90% of the users a UA team worked to acquire are gone within a month.
High-intent categories tell a different story. Fintech apps retain around 11 to 15% at Day-30 because managing money is a near-daily activity. Subscription apps and other high-commitment categories routinely post Day-30 retention at two to three times the cross-category average. The driver is intent. These users self-select into ongoing utility before the paywall. Lower-intent cohorts include large volumes of tourist installs, users who came through the door with no particular commitment to staying.
Paid acquisition cohorts retain worse than organic. Referral-driven users retain best of all. The users most expensive to acquire are, on average, the ones least likely to stick around.
That is not an argument against paid UA. It is an argument for understanding exactly what paid UA is producing at the cohort level and building a program that optimizes around it rather than ignoring it.
Here is where most teams get the framing wrong.
Retention is influenced before the user ever touches the product. The creative that drove the install set an expectation. The audience segment that creative reached had certain characteristics. The channel it ran on attracted a certain kind of user. All of those upstream decisions shape who shows up on Day-1 and whether they are the kind of user who sticks.
Apps with personalized onboarding tied to acquisition context retain meaningfully better than apps with generic flows. Real one-to-one personalization has been shown to lift retention rates by up to 45%, and apps that nail first-session activation retain at two to three times the rate of apps that don’t, regardless of category. The teams connecting acquisition context to onboarding experience, meaning the user who came through a specific creative or campaign gets an onboarding flow tailored to that entry point, are seeing better retention without changing anything about the core product.
That connection requires acquisition and product to be working from the same user insight. In most organizations, that conversation is not happening. The UA team knows which creatives drove installs. The product team knows where users drop off in onboarding. Almost nobody is asking whether those two datasets are related, and they almost always are.
Creative is a retention input that most teams do not count as one.
An ad that accurately represents the product attracts users with realistic expectations. Users with realistic expectations are more likely to find what they came for. Users who find what they came for are more likely to come back.
An ad that oversells, misleads through implication, or attracts users primarily through an offer rather than through genuine product interest produces a different kind of cohort. Higher install volume, weaker Day-7 retention, steeper drop-off curves. The creative looked like it worked because the CPI was acceptable. The retention data tells a different story.
The best-performing UA teams evaluate creative concepts not just on install efficiency but on downstream cohort behavior. Does this creative attract users who open the app on Day-3? Who complete onboarding? Who convert to paid? Those questions require connecting campaign-level creative data to product-level retention data, which requires a measurement setup most teams have not built.
Apps that run 50 or more experiments earn 18.7 times more than apps that run just one. That number is not just about paywalls or pricing. It applies equally to the creative testing discipline that determines what kind of user shows up in the first place.
Here is a way to think about the financial impact that tends to land differently than abstract percentages.
If a UA team is acquiring 10,000 users per month at $5.00 CPI, that is $50,000 in monthly acquisition spend. At a cross-category Day-30 retention of 5%, roughly 500 of those users are still active after a month. At the 12 to 15% retention that high-intent categories like fintech and subscription apps achieve, that number lands closer to 1,200 to 1,500. The difference is 700 to 1,000 retained users per month from the same spend.
Over a year, at even modest monetization, that gap compounds into a significant revenue difference. The acquisition spend is identical. The retention performance determines whether it is a viable business or a leaky bucket.
The teams closing that gap are doing it through a combination of better creative targeting, onboarding personalization, and cohort-level measurement that connects acquisition decisions to retention outcomes. Hybrid monetization models combining ads, subscriptions, and in-app purchases improve lifetime value by roughly 30% over single-stream models. That 30% does not come from spending more on UA. It comes from building a better system around the users you are already acquiring.
Most UA conversations start and end with acquisition. CPI, install volume, ROAS, channel mix. These are the metrics that dominate weekly reviews and quarterly planning.
Retention sits in a different room, usually with the product team, is evaluated on a separate dashboard, and treated as a product problem rather than a growth problem. The two conversations rarely happen at the same time with the same people.
That separation is costing real money, and the data makes exactly how much very clear.
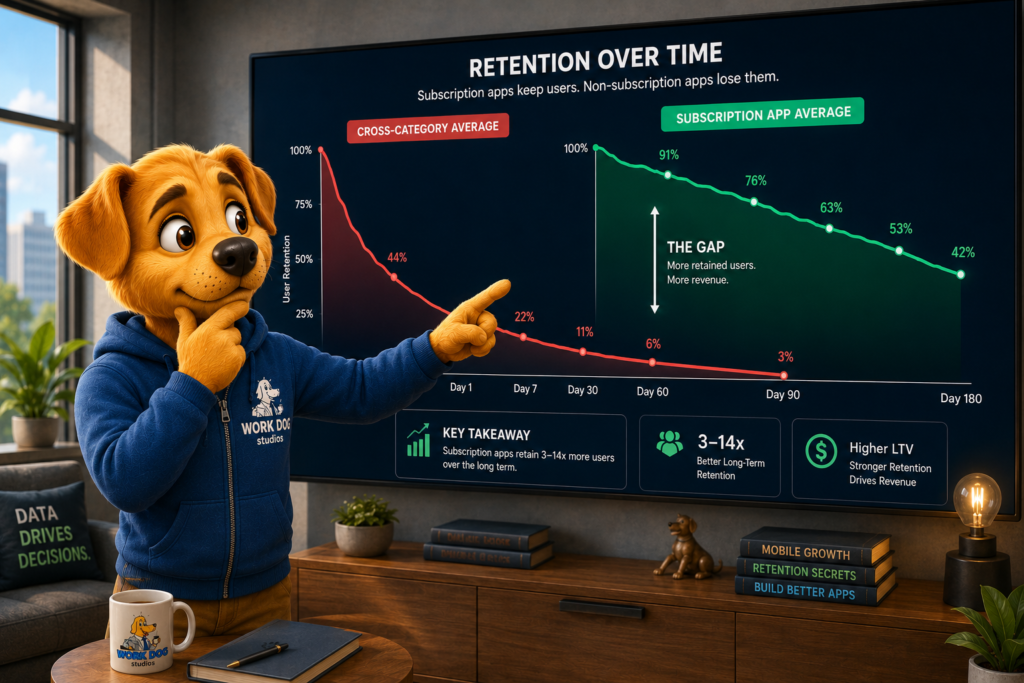
Average Day-30 retention across all app categories sits at 5.4% in 2026. Day-1 is 26%. Day-7 is 11%. By Day-30, more than 94% of the users the UA team worked to acquire are gone.
Subscription apps post Day-30 retention near 14%, more than 2.5 times the cross-category mean. At Day-90, the gap widens further: 7.9% for subscription apps versus 1.7% for primarily ad-monetized apps. The driver is intent. Subscription users self-select into ongoing utility before the paywall. Ad-monetized cohorts include large volumes of tourist installs, users who came through the door with no particular commitment to staying.
Paid acquisition cohorts retain worse than organic. Referral-driven users retain the best of all. The users most expensive to acquire are, on average, the ones least likely to stick around.
That is not an argument against paid UA. It is an argument for understanding exactly what paid UA is producing at the cohort level and building a program that optimizes around it rather than ignoring it.
Here is where most teams get the framing wrong.
Retention is influenced before the user ever touches the product. The creative that drove the install set an expectation. The audience segment that creative reached had certain characteristics. The channel it ran on attracted a certain kind of user. All of those upstream decisions shape who shows up on Day-1 and whether they are the kind of user who sticks.
Apps with personalized onboarding see 2.3 times higher Day-30 retention than apps with generic flows. The teams connecting acquisition context to onboarding experience, meaning the user who came through a specific creative or campaign gets an onboarding flow tailored to that entry point, are seeing meaningfully better retention without changing anything about the product itself.
That connection requires acquisition and product to be working from the same user insight. In most organizations, that conversation is not happening. The UA team knows which creatives drove installs. The product team knows where users drop off in onboarding. Almost nobody is asking whether those two datasets are related, and they almost always are.
Creative is a retention input that most teams do not count as one.
An ad that accurately represents the product attracts users with realistic expectations. Users with realistic expectations are more likely to find what they came for. Users who find what they came for are more likely to come back.
An ad that oversells, misleads through implication, or attracts users primarily through an offer rather than through genuine product interest produces a different kind of cohort. Higher install volume, weaker Day-7 retention, steeper drop-off curves. The creative looked like it worked because the CPI was acceptable. The retention data tells a different story.
The best-performing UA teams evaluate creative concepts not just on install efficiency but on downstream cohort behavior. Does this creative attract users who open the app on Day-3? Who completes onboarding? Who converts to paid? Those questions require connecting campaign-level creative data to product-level retention data, which requires a measurement setup most teams have not built.
Apps that run 50 or more experiments earn 18.7 times more than apps that run just one. That number is not just about paywalls or pricing. It applies equally to the creative testing discipline that determines what kind of user shows up in the first place.
Here is a way to think about the financial impact that tends to land differently than abstract percentages.
If a UA team is acquiring 10,000 users per month at $5.00 CPI, that is $50,000 in monthly acquisition spend. At cross-category average Day-30 retention of 5.4%, roughly 540 of those users are still active after a month. At subscription app, Day-30 retention of 14%, that number would be 1,400. The difference is 860 retained users per month from the same spend.
Over a year, at even modest monetization, that gap compounds into a significant revenue difference. The acquisition spend is identical. The retention performance determines whether it is a viable business or a leaky bucket.
The teams closing that gap are doing it through a combination of better creative targeting, onboarding personalization, and cohort-level measurement that connects acquisition decisions to retention outcomes. Hybrid monetization models combining ads, subscriptions, and in-app purchases improve lifetime value by roughly 30% over single-stream models. That 30% does not come from spending more on UA. It comes from building a better system around the users you are already acquiring.
The mobile app retention conversation and the UA conversation need to be in the same room. The creative that drives an install shapes the cohort that shows up. The cohort that shows up determines what the retention curve looks like. The retention curve determines whether the UA economics work. These are not separate problems with separate owners. They are one problem that requires the acquisition team and the product team to be working from the same data.
If your retention numbers are not keeping pace with your acquisition spend and you want to figure out where the disconnect is, the Work Dog team works through exactly this kind of analysis with clients. Reach out and let’s get into it.