Cheap installs are the most seductive number in mobile marketing. CPI drops, the dashboard turns green, the weekly report writes itself, and everyone agrees the campaign is working. It is the easiest win to show a boss and the hardest one to argue with.
It is also the number most likely to be quietly destroying your unit economics.
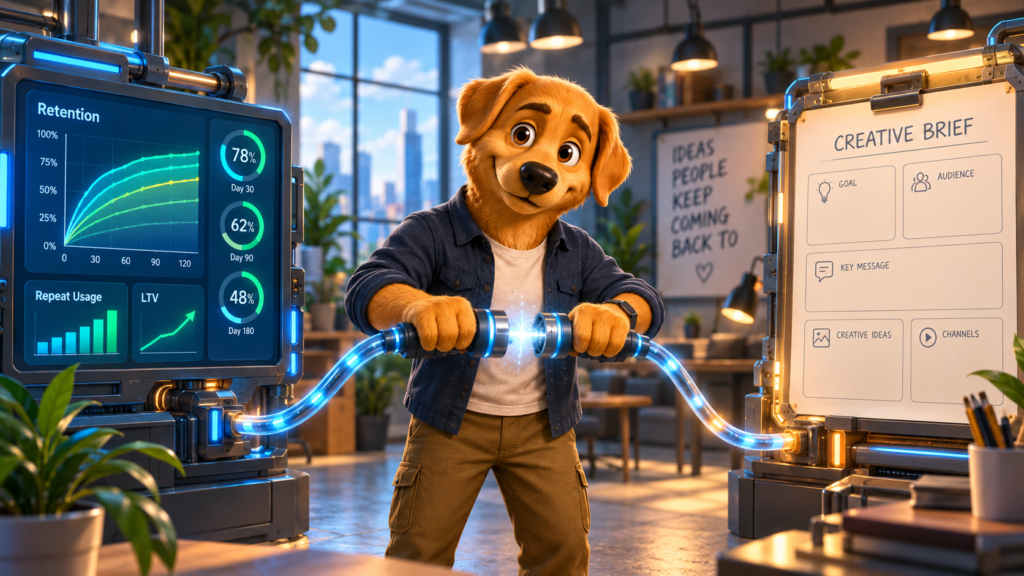
The data on this has gotten hard to ignore. Mobile game D1 retention averages 26 to 27% globally. By D7 it falls to around 10%. By D30 it drops below 4%. More than 95% of acquired users are gone inside a month. In that environment, driving CPI down without watching what happens after the install is pouring water into a leaking bucket faster.
Here is what the numbers actually say about cheap installs, read from the media buying chair and the creative chair, because the two lenses land in the same place from opposite directions.
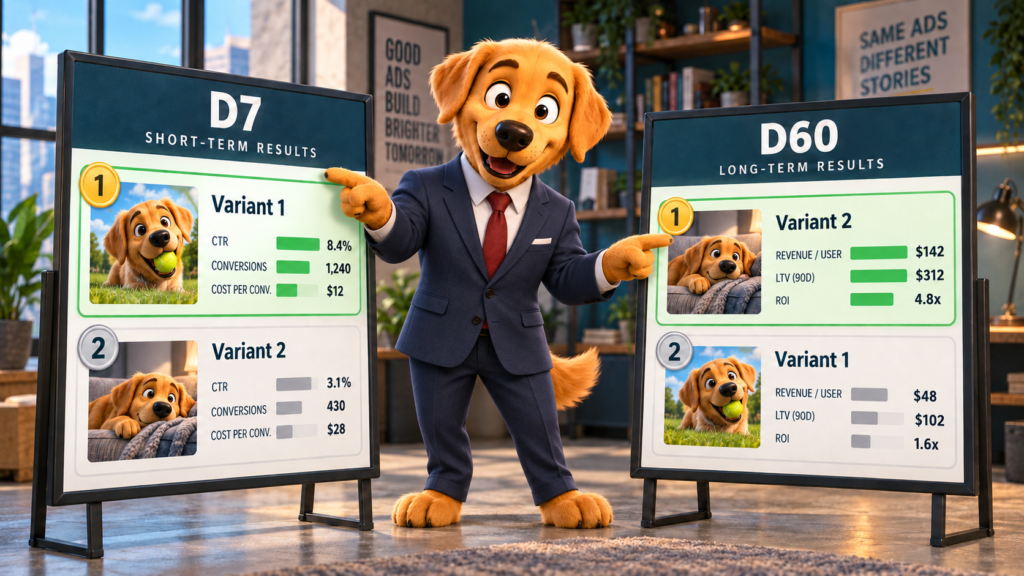
CPI measures the cost of an install. It says nothing about the value of a user. That distinction sounds obvious written down and gets forgotten constantly in practice, because CPI updates daily while value takes weeks to reveal itself.
The gap between those two things is where the money goes. A $0.50 install that never opens the app again is worth less than a $4.00 install that subscribes. Apple Search Ads campaigns typically run around 50% higher CPI than Meta and deliver roughly 2x better Day-30 retention, which means the expensive channel is frequently the cheaper one once you measure what you actually bought.
Geography makes the same point at scale. The same targeting that costs $5.50 per install in the US can cost $0.80 in Brazil. That looks like a 7x efficiency gain until lower ARPU and higher churn in emerging markets neutralize most of the savings. The install got cheaper. The user got cheaper too.
The metric that resolves all of this is cost per retained user. What did you pay for someone who is still here in 30 days? A high-CPI campaign backed by strong retention is efficient. A campaign full of cheap installs where users churn on day one is a loss that scales with your budget. If D7 retention sits below 10%, spending more on cheap installs accelerates the losses rather than reducing them.
From the UA chair, the practical failure is that CPI is still being used as an optimization target when it works far better as a diagnostic.
Bidding on CPI teaches the algorithm to hunt for cheap installs, which means finding the users least likely to be worth anything, because the cheapest install is by definition the one nobody else in the auction wanted. You get exactly what you asked for. Most sophisticated UA teams have moved to tCPA, tROAS, or value-based event bidding for this reason. Those bid strategies raise your apparent CPI and lift cohort quality at the same time, and that trade is almost always worth taking.
Retention-tied bidding, meaning target ROAS and predictive LTV models, is now the default for any app with a subscription tier. The reason is structural. iOS CPI rose 19% year over year while iOS ARPU grew only 7%, compressing the margin between what you pay and what you earn. When that margin tightens, the teams still optimizing toward volume get squeezed hardest, because they have the least room for a cohort that underperforms.
The disciplined use of CPI is as a rate check across creative and geo rather than as the thing you optimize toward. Read it alongside D7 and D30 retention by source, D30 ROAS, and payback period. A campaign whose CPI climbed 20% while its D30 ROAS doubled is a campaign that got better, and a CPI-first read of it will tell you the opposite.
One more note from the buying side. Before scaling any spend, confirm your retention curve sits at or above your category median. Paid UA on a leaky retention curve just makes the leak bigger and more expensive.
Here is where the creative lens delivers something the media buying lens cannot see on its own, and it is the most useful data in this entire discussion.
Different creative formats produce systematically different install costs and systematically different install quality, and the two run in opposite directions.
Static and banner ads deliver the lowest CPI, roughly $0.50 to $2.00, and the worst conversion and engagement outcomes. Video sits in the middle at roughly $2.00 to $5.00, with strong performance when the creative resonates. Playable ads carry the highest CPI, roughly $3.00 to $7.00, and deliver the best qualified installs of any format.
Read that ladder again, because it means the cheapest creative format on the market is also the one most likely to fill your app with users who leave. A team chasing cheap installs will drift toward static formats almost automatically, since statics are cheap to produce and cheap to serve. They will hit their CPI target and wonder why retention keeps sliding.
Playables cost more per install for a good reason. They make the user do something before they convert. That interaction filters for genuine intent, so the person who installs after playing a playable already knows what the product is and has demonstrated they want it. The format is doing qualification work before the install ever happens.
This is why format selection is a media decision as much as a creative one, and the market has been repricing it accordingly. Playable impression share nearly doubled in a single year while static image share fell sharply. The teams paying attention figured out that a more expensive install from an engaged user beats three cheap ones from people who tapped by accident.
The other creative lever worth naming is your store listing. A/B testing icons, screenshots, and preview videos lifts install conversion rate, which means the same impressions produce more installs at a lower CPI without any drop in user quality. That is the one place where a lower CPI is unambiguously good news, and it comes from creative work rather than from bidding down.
The connection between these two reads is direct, and missing it is what makes the cheap installs trap so persistent.
When a UA team is measured on CPI, the creative brief that follows optimizes for the cheapest possible install. More statics, broader hooks, softer qualification, anything that raises the install rate regardless of who is installing. The creative team delivers exactly what was asked for. The cohort quality drops. The retention curve sags. Nobody connects the two because the creative request and the retention report live in different meetings.
Flip the measurement to cost per retained user and the entire creative brief changes. Suddenly playables and high-intent video earn their higher production cost. Suddenly it makes sense to build creative that shows the actual product experience rather than the flashiest possible hook, because setting an accurate expectation is what keeps a user past D1. Suddenly the creative team is being asked to filter rather than to maximize.
That is the whole game. The metric you optimize toward writes your creative brief, whether or not anyone says so out loud. Teams where media buying and creative development are one connected operation catch this immediately, because the person reading the retention data and the person briefing the next creative round are working from the same numbers. Teams where those functions are split keep optimizing toward cheap installs and keep wondering why the users do not stay.
Cheap installs are a symptom that gets mistaken for a strategy. CPI measures what you paid at the top of the funnel and tells you nothing about what you bought, and with more than 95% of users churning inside 30 days, what you bought is the only thing that matters.
The media buying fix is to bid on value rather than volume and to treat CPI as a diagnostic. The creative fix is to recognize that your format is selecting your users, and that the formats which qualify intent cost more per install for exactly the reason that makes them worth it. Both fixes point the same direction, and they only work when the team running the media and the team building the creative are reading the same retention data.
If your CPI looks great and your retention curve does not, that gap is usually a creative brief problem wearing a media buying costume. Reach out and let’s get into it.